Data literacy

Facts?
Cover photo is from Wikipedia and showed up when I googled “liar” so it must be true [tic].
I really wanted to blog about something else for the last few days, but I’ve been kind of depressed by the state of data literacy and I had to talk about it.
We have more information available at our fingertips than any other people before us. That fact alone should make us the most informed and enlightened humans to walk the face of the Earth, but the result has been far from that. Instead large majorities of the population latch on to statements that don’t make sense and are often easily proven wrong by looking at the raw data. I have no data on how many statements floating around the collective intelligence are misleading or plain wrong, but whatever the statistics are I don’t feel wrong in saying it is too high.
The straw that broke this camel’s back
In the last few weeks I have seen so many things forwarded to me (not in any of the few news sources I do consume though) that sounded odd. The numbers didn’t look right at a first glance. In almost all of the cases the numbers or information were being used as a foundation for claiming that another group was wrong or misleading people. I will not even touch the subjects. In many ways the subjects are not the problem, just the daily manifestation we all are encountering. Most of them will fade with time and we shouldn’t waste too much energy on them no matter what side we fall on with an issue.
Today I received one talking about a finding that was being censored. Looking at the social media around the claims there was a lot of rhetoric, but no data. The graphs were oddly done, but people on one side held them up and people on the other side kicked them aside. No one did what all of us should do in this case. Look at the data.
I spent about 10 minutes and found the original reference data on the appropriate government website. Plotting the data not only could I tell the original claim was wrong, I could tell that the other side was not seeing the problem either. Both sides were wrong for different reasons and in different ways. I spent 30 minutes from beginning to end looking at the data to realize that all of the chatter was destructive noise. Why hadn’t anyone else?
Was downloading the data set and throwing it into a spreadsheet too hard for everyone yelling at each other in social media? Apparently it was and that made me angry and depressed at the same time.
Intellectual Honesty
I hold a concept very highly, that of intellectual honesty. The root of the concept is that we should always strive to be honest about what we know and don’t know, especially when it is painful and may negate closely held beliefs. Striving to be more intellectually honest helps us and the people around us by being able to confront issues with the best knowledge of the moment. It is also a realization that we are often mentally wrong and overcoming emotional bias and preconceived notions is difficult, but always worth it.
There are a few ways of doing this better.
- The data forms the narrative. The narrative never affects the data.
- Additional data always informs the estimation of what is going on.
- If data needs to be discarded there is a flaw somewhere.
- Always verify the data the best you can.
The “stories” I was receiving recently violated all of these. Some more obviously than others, but it was obvious that the writers were not adhering to the same concept, and the people passing them around didn’t check, but rather became a conduit for those ideas to spread.
Many of the ideas came from people that had a narrative that they needed to reinforce. Many of them allowed that need to blind them in the face of information. Others intentionally mislead others to reinforce the shared narrative in a way they wanted. I do want to believe that the people intentionally doing this are a very small minority, but I have no evidence either way.
Data literacy
Let’s assume that most people do not willing want to spread falsehoods (if not true I think we can give up on this version of society right now). What everyone needs to do is become better at digital literacy. That means looking at data when it comes in, splitting it from the narrative and judging for yourself in an intellectually honest manner.
I’m not sure how to tell someone when to not trust data, but I think they can build a sense for when to check it by checking data in general. Someone tells you the leading cause of death is X, go check it yourself. Googling is often the first stop, maybe Wikipedia. The second stop will be the links each provides. Finally you should probably look at authorities, like in the example the CDC would be a good choice.
As you look for the validity of the data you should read the details around it to understand what we don’t know. Maybe there is a gap in the data for some reason, or a known error in it’s collection. Neither makes the data worthless, but both need to be dealt with appropriately.
A little bit of math
There is a need for a little bit of math though. On another day I will explain why I think you can’t be an educated person without some mathematical understanding. In this case understanding how to make or at least read a graph is important.
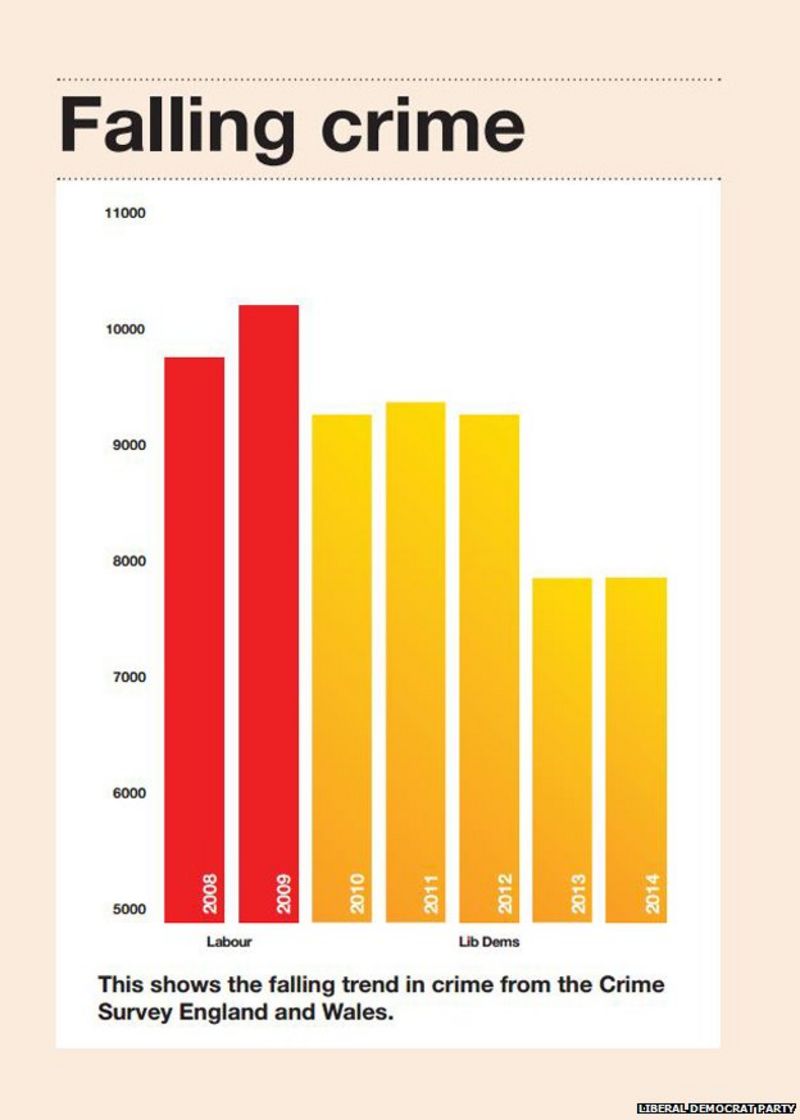
Figure 1 shows us where a graph can be manipulated to show big swings where none exist. In this case the change is magnified by a 2x because the bottom half of the graph is cut off. The Y-Axis not starting at 0 should be a stink to look more closely.
With the story I received today I pulled the data into a graph immediately. It was about a 1000 data points, with 100 being an aggregate. Plotting that aggregate and then stacking the varied types in a separate chart it was obvious that the information in the story was wrong. If just a few people along the way did the same I doubt it would have ever reached me (I am in the social media back waters). You don’t even need to do it all the time. If everyone did it 5% of the time I doubt misinformation would last more than 10 feet or 30 seconds.
Of course graphs are only as useful as the people making them and reading them. A poorly made graph could turn good intentions into a bad result. Understanding basic statistics is key. More advanced concepts help even more but I can’t expect the whole population to grasp everything.
Listen, think, then speak
There is a math problem that asks
A bat and a ball cost $1.10 in total. The bat costs $1.00 more than the ball. How much does the ball cost?
I think almost everyone can solve this correctly, but we don’t want to spend the time to mull it over. We blurt the first answer that comes to our head and it is often wrong. Taking what might seem like the most trivial problem and considering it before proceeding may seem wasteful, but not doing it is a waste of time and effort when you get it wrong.
When the subject is a sensitive one that treads on belief narratives many people will go to their belief quickly. If they spent the time to look at the information in front of them the world would be a much better space. Unfortunately they have people shouting dogma coming out of lit boxes and rectangles that makes it harder to spend the time and think straight.
Remember the shouting people are shouting so you don’t think for yourself. It could be because they make money by shouting or that they can’t let their own beliefs be compromised. Either way that shouting is the next indicator that you need to look at the data more closely before accepting new information. If you don’t you are going to answer that the ball costs 10 cents.